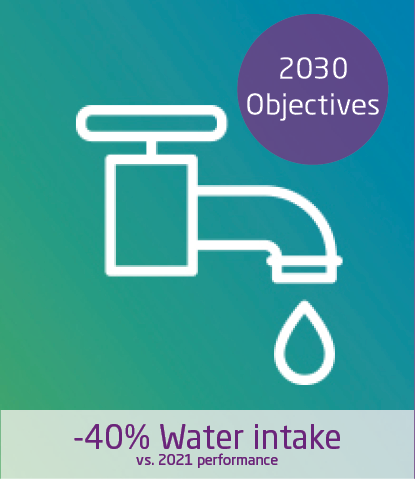
With water becoming an increasingly scarce resource, restrictions on its use and on the quality of the water discharged will become more and more common. As a result, Aperam has defined a 40% reduction target in terms of water consumption over 2021.
An Everyday Affair
At Aperam, our commitment to clean water is an everyday affair, one that is fully ingrained in how we operate.
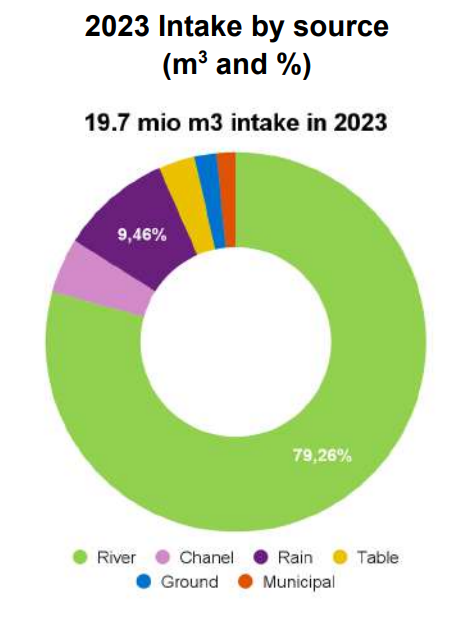
With the aim of reducing water consumption by 40% by 2030 (over 2015 rate), we routinely monitor our water intake. We also continue to increase the amount of recycled water we use, which is currently at 97.8%. Of the 4% of water that we do extract, 79% comes from rivers and 9% from collected rain, and most of the water (66% in 2023) we do withdraw is returned to the river after treatment.
We also monitor the quality of the water we discharge into rivers to ensure it complies with our permits in terms of volumes, pH, temperature, particles of suspended solids, and metals in water. In 2023, we reported a total water discharge of 13.1 million m3 -20.3% from 2012), including 5.204 kg/tcs of metal discharge (+44%% from 2022) and 81.711 g/tcs of suspended solids (-29% from 2022).
Progress Being Made
To ensure we meet our 2030 targets, many of our sites are taking specific steps to reduce consumption.
For example, following ongoing droughts, our Gueugnon site has made water conservation and management a major priority. The site’s current withdrawal rate is approximately 750,000m³/year. But initiatives like the installation of an adiabatic tower on our annealing and pickling line (RD79) and the revamping of our bright annealing furnace (RB08) have yielded tangible results in water savings.
Alone, the upgraded RD79 prevented the consumption of around 25,000m³ over four months, while the RB08 revamp significantly reduced average consumption from 4.55 m³/h in 2022 to 1.7 m³/h in 2023.
Additionally, re-use strategies, like those implemented on RD79, further contribute to conservation goals.
These efforts, combined with ongoing field actions, have enabled the site to maintain progress towards achieving its annual water conservation target of 4.3m³. However, every individual plays a crucial role in ensuring efficient water usage and conservation, which is why the Group is preparing a specific policy on water consumption. Once finalized, it will provide best practices in mapping, standardized measurement protocols, and serve as the basis for a rigorous, site-level water management plan.
 0,90%
0,90%